


2025 theme park attendance revealed: Epic Universe boosts Orlando
The TEA Global Experience Index compiled by the Themed Entertainment Association (TEA) reveals that attendance at the world’s top 25 theme parks totaled 245.4 million visits in 2025, (a slight decline of 0.2% from 2024).
Produced by TEA with research partners Entertainment + Culture Advisors (ECA) and The Park Database (TPDB), and presenting partner Storyland Studios, the TEA Global Experience Index tracks attendance at the world’s most-visited theme parks, water parks, and museums.
The TEA Global Experience Index reports that attendance at the world’s top 25 theme parks remained essentially flat in 2025, declining 0.2%. Europe’s four parks on the list collectively added more than 1.1 million visits, while Epic Universe helped lift combined attendance at Central Florida’s leading theme parks by 4.3%.
“This year’s findings show both the resilience of established markets and the growing importance of destinations that bring together a range of experiences,” said TEA CEO Melissa Ruminot.
Top 25 theme parks worldwide in 2025
The world’s top 25 theme parks recorded approximately 245.4 million visits in 2025, down 0.2% from approximately 245.9 million at the same parks in 2024.
Disney operated or licensed 12 of the parks on the worldwide list, including six in the United States. Universal claimed five spots, with Epic Universe’s first-year attendance falling below the worldwide top 25 threshold.
| Rank | Theme park | 2025 attendance | Change from 2024 |
|---|---|---|---|
| 1 | Magic Kingdom | 17,800,000 | -0.2% |
| 2 | Disneyland | 17,406,000 | +0.4% |
| 3 | Universal Studios Japan | 16,040,000 | +0.2% |
| 4 | Tokyo Disneyland | 15,200,000 | +0.6% |
| 5 | Shanghai Disneyland | 14,994,000 | +2.0% |
| 6 | Chimelong Ocean Kingdom | 12,666,000 | +0.3% |
| 7 | Tokyo DisneySea | 12,600,000 | +1.3% |
| 8 | Epcot | 12,109,000 | -0.2% |
| 9 | Disneyland Park, Paris | 10,800,000 | +5.7% |
| 10 | Disney’s Hollywood Studios | 10,312,000 | -0.2% |
| 11 | Disney California Adventure | 10,090,000 | +0.4% |
| 12 | Universal Studios Beijing | 9,804,000 | +0.3% |
| 13 | Universal Studios Florida | 9,300,000 | -2.1% |
| 14 | Universal Islands of Adventure | 9,200,000 | -2.6% |
| 15 | Disney’s Animal Kingdom | 8,782,000 | -0.2% |
| 16 | Universal Studios Hollywood | 8,000,000 | -8.0% |
| 17 | Hong Kong Disneyland | 7,700,000 | -3.0% |
| 18 | Europa-Park | 6,250,000 | +0.8% |
| 19 | Walt Disney Studios Park, Paris | 5,919,000 | +5.7% |
| 20 | Efteling | 5,780,000 | +3.2% |
| 21 | China Dinosaurs Park | 5,610,000 | +4.3% |
| 22 | Lotte World Adventure | 5,055,000 | -4.6% |
| 23 | Everland | 4,727,000 | -15.6% |
| 24 | Nanning Fantawild Asian Legend | 4,657,000 | +1.2% |
| 25 | Shanghai Haichang Ocean Park | 4,645,000 | -1.8% |
Source: 2025 TEA Global Experience Index. Park names reflect the reporting year.
Europe’s four parks on the list collectively added more than 1.1 million visits. Both Disneyland Paris parks grew 5.7%, while Efteling increased 3.2% and Europa-Park grew 0.8%.
South Korea’s parks experienced sharper declines. Everland’s attendance fell 15.6%, while Lotte World Adventure dropped 4.6%. TEA identified extreme summer weather as a contributing factor in the region.
Epic Universe records 4 million visits in its opening year
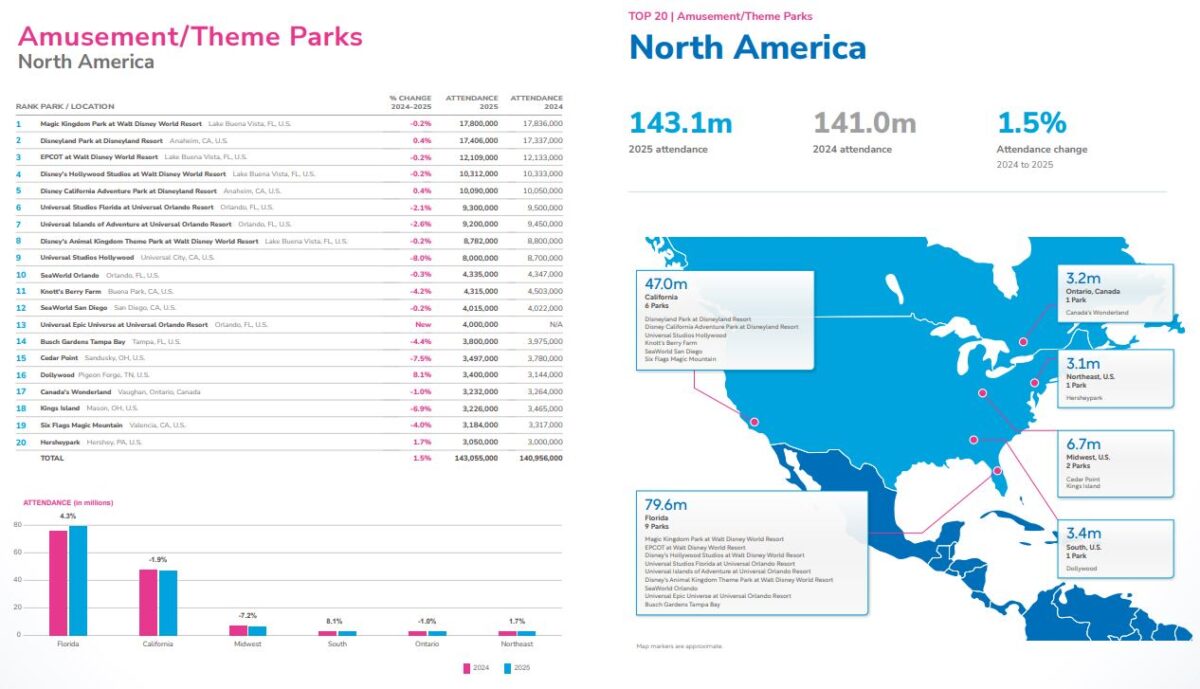
Epic Universe opened May 22, 2025, and recorded an estimated 4 million visits before the end of the year, placing it at No. 13 among North American theme parks.
Attendance declined at Universal Orlando’s two established theme parks: Universal Studios Florida fell 2.1% to 9.3 million visits, while Islands of Adventure declined 2.6% to 9.2 million.
Including Epic Universe, Universal Orlando’s three theme parks recorded approximately 22.5 million visits. That compares with 18.95 million at its two theme parks in 2024, a net increase of approximately 3.55 million visits. These totals exclude Volcano Bay.
Epic Universe helped increase combined attendance across Orlando’s leading theme parks, despite slight declines at the seven established Orlando parks included in the report’s North American rankings.
Courtesy of TEA
Epic Universe’s figure represents a partial operating year, an important distinction when comparing its attendance with parks open throughout 2025.
Disney World attendance holds nearly steady
All four Walt Disney World theme parks recorded attendance declines of approximately 0.2%, according to the report.
Combined, Magic Kingdom, Epcot, Disney’s Hollywood Studios, and Disney’s Animal Kingdom recorded 49,003,000 visits, compared with 49,102,000 in 2024. That amounts to a decrease of 99,000 visits across the four parks.

Photo by Dani Meyering
Magic Kingdom remained the world’s most-visited theme park, recording 17.8 million visits compared with Disneyland’s 17.4 million.
Disneyland Resort’s two California parks each grew approximately 0.4%. Disneyland recorded 17,406,000 visits, while Disney California Adventure reached 10,090,000.
Internationally, Shanghai Disneyland approached 15 million visits, while Tokyo Disneyland and Tokyo DisneySea also posted increases. Hong Kong Disneyland’s attendance declined 3%.

Photo by Mai
Dollywood stands out among North American parks
North America’s top 20 theme parks recorded approximately 143.1 million visits, up 1.5% from the 2024 comparison total.
Beyond Disney and Universal, Dollywood delivered a notable increase. The Tennessee park welcomed an estimated 3.4 million visits, up 8.1%, representing the strongest percentage growth among established parks on the North American top 20 list.
Hersheypark also grew, increasing 1.7% to 3.05 million visits.
Other notable North American results included:
| Theme park | North American rank | 2025 attendance | Change from 2024 |
|---|---|---|---|
| SeaWorld Orlando | 10 | 4,335,000 | -0.3% |
| Knott’s Berry Farm | 11 | 4,315,000 | -4.2% |
| SeaWorld San Diego | 12 | 4,015,000 | -0.2% |
| Epic Universe | 13 | 4,000,000 | New |
| Busch Gardens Tampa Bay | 14 | 3,800,000 | -4.4% |
| Cedar Point | 15 | 3,497,000 | -7.5% |
| Dollywood | 16 | 3,400,000 | +8.1% |
| Canada’s Wonderland | 17 | 3,232,000 | -1.0% |
| Kings Island | 18 | 3,226,000 | -6.9% |
| Six Flags Magic Mountain | 19 | 3,184,000 | -4.0% |
| Hersheypark | 20 | 3,050,000 | +1.7% |
Every Six Flags-operated park on the North American top 20 list recorded a decline. The report identifies weather as a significant factor affecting several regional parks during the year.

Photo by Matt Roseboom
Blizzard Beach attendance jumps as Disney water park operations expand
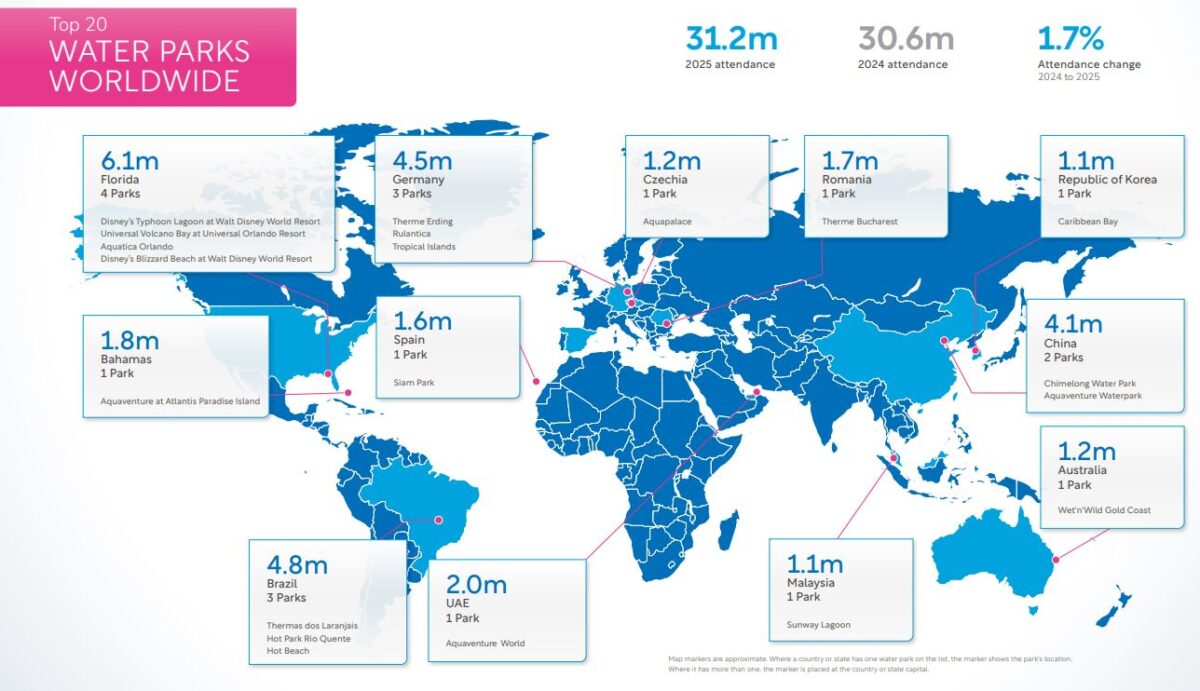
Chimelong Water Park in China retained the top spot in the worldwide water park rankings, with approximately 2.56 million visits.
In Central Florida, Disney’s Typhoon Lagoon recorded approximately 1.76 million visits, followed by Universal Volcano Bay at 1.6 million and Aquatica Orlando at 1.4 million.
Disney’s Blizzard Beach posted a substantial increase, growing 50.5% to 1.35 million visits, compared with 897,000 in 2024.
TEA attributes that increase to the return of both Disney water parks to regular seasonal operation following the alternating schedules used during the pandemic recovery period. The operating calendar provides important context for the attendance jump.
Courtesy of TEA
What is the TEA Global Experience Index?
Formerly known as the Theme Index and Museum Index Report, the TEA Global Experience Index tracks attendance at leading theme parks, water parks, museums, and attraction operators worldwide.
The Themed Entertainment Association produces the study with research partners Entertainment + Culture Advisors and The Park Database. Storyland Studios serves as presenting partner, with Moongate Design Studio as design partner and InPark Magazine as editorial partner.
The figures draw on operator-provided statistics, historical attendance, financial reports, tourism organizations, attraction associations, mobile location analytics, and professional estimates where necessary. The report combines these sources, including estimates; its figures are not uniformly disclosed official park counts.
Attendance measures visits, not unique people. A guest visiting multiple parks can contribute to more than one park’s total.
Now in its 20th annual edition, the report also covers museums and includes a special cruise industry section. The top 20 museums recorded approximately 161.4 million visits in 2025, an increase of 5.4%.
The full 2025 TEA Global Experience Index is available free through TEA. Readers can also compare this year’s findings with our 2024 theme park attendance rundown.
Follow us:
More Attractions Magazine stories:
No matter where you want to go, our trusted partner MEI-Travel will handle the planning so you can focus on the memories. They offer free vacation-planning services and have nearly 20 years of experience creating memorable vacations. Visit MEI-Travel for a fee-free, no-obligation quote today.